How to Build Salesforce Dashboards Your Executives Will Actually Use
Start with the decisions executives need to make, not the data you have. Most Salesforce dashboards fail because they try to show everything, rely on data leaders don't trust, or answer questions nobody is asking. Dashboards executives actually use are focused, built around a handful of metrics tied to business goals, designed to be read in under a minute, and backed by clean, consistent data.
Quick Answer: To build Salesforce dashboards executives will use, start by interviewing leaders about the decisions they make and the questions they ask each week. Pick five to eight key metrics tied to company goals, define each one clearly, and make sure the underlying data is clean. Design for a quick read, with the most important numbers at the top, trends instead of raw lists, and targets for context. Use dynamic dashboards and filters so each leader sees the right view, schedule delivery, and review the dashboard regularly with leadership to keep it relevant.
Key Takeaways:
Executive dashboards should answer specific business questions, not display every available report.
Five to eight well-defined metrics beat twenty components nobody reads.
Trust is everything. If the data is wrong once, executives stop using the dashboard.
Design for a 60-second read: key numbers first, trends and targets for context, details on drill-down.
Adoption happens when dashboards are used in leadership meetings, not just shared by email.
Why Most Executive Dashboards Get Ignored
Almost every Salesforce org has a graveyard of dashboards. Someone built them for a launch, a board meeting, or a new VP, and now nobody opens them. The reasons are almost always the same:
Too much information. Twenty components on one page make it impossible to see what matters.
The wrong metrics. Activity counts and raw lists don't answer strategic questions.
Inconsistent definitions. Sales and finance calculate pipeline or bookings differently, so the numbers don't match.
Untrusted data. Duplicates, stale opportunities, and missing fields make the numbers unreliable.
No routine. If the dashboard isn't part of how leaders run the business, it's forgotten.
The bottleneck isn't Salesforce reporting. It's designing for how executives actually make decisions.
Step 1: Start with the Decisions, Not the Data
Before building anything, talk to the executives who will use the dashboard. Ask:
What decisions do you make each week or month?
What questions do you ask your team most often?
What numbers do you report to the board or CEO?
What would make you change course if you saw it early?
The answers define what belongs on the dashboard. Anything that doesn't support a decision or answer a recurring question doesn't make the cut.
Step 2: Choose Five to Eight Key Metrics
Executive dashboards work best when they're focused. Common metrics include:
Revenue and bookings against target
Pipeline coverage for the current and next quarter
Win rate and average deal size
Sales cycle length
Forecast by category
Customer retention or renewal rate
Case volume and resolution time for service leaders
Pick the ones tied directly to company goals, and leave operational detail for team-level dashboards.
Step 3: Define Every Metric Clearly
Agree on exactly how each metric is calculated, including which opportunities count, which dates are used, and how currencies and record types are handled. Document the definitions and align them with finance where relevant. When two leaders see the same number and disagree on what it means, the dashboard loses credibility.
Step 4: Fix the Data Before You Visualize It
A dashboard is only as trustworthy as the data behind it. Before launch:
Clean up duplicates and stale opportunities
Enforce required fields at key opportunity stages
Standardize picklists like lead source, industry, and region
Make sure close dates and amounts are kept current
If executives catch one wrong number, they'll stop trusting the whole dashboard.
Step 5: Design for a 60-Second Read
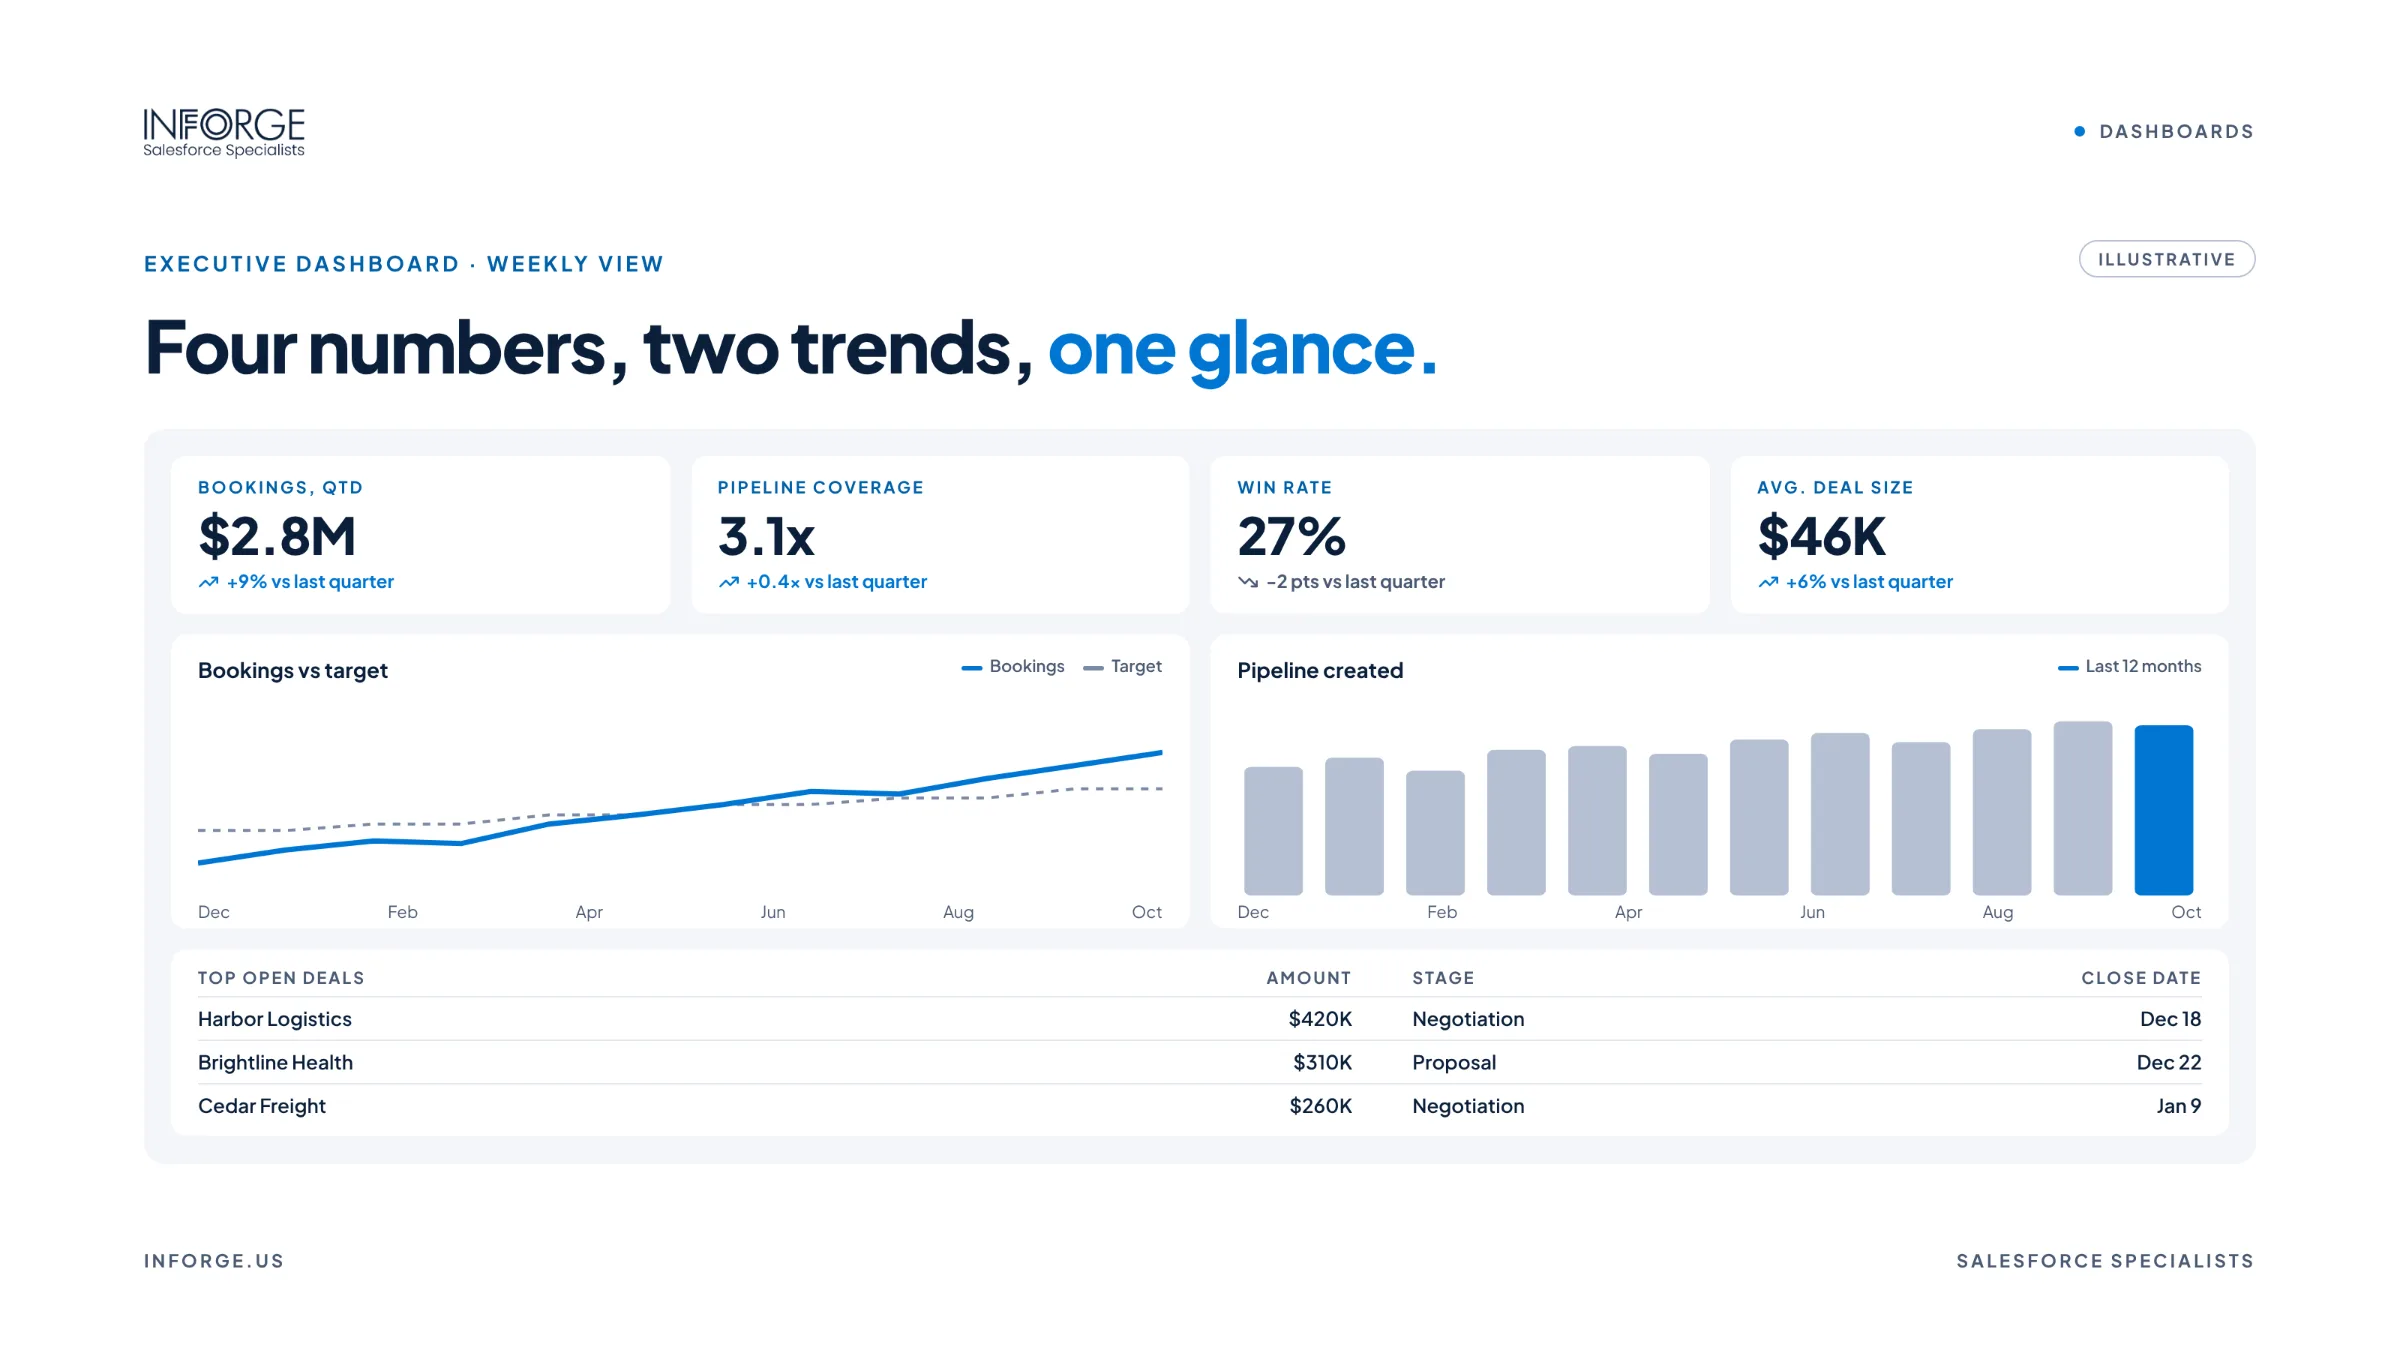
Executives should understand the state of the business at a glance.
Put the most important metrics at the top left, where the eye lands first.
Use metric components with targets so a number has context, like bookings versus goal.
Show trends over time rather than a single point.
Choose simple visuals. Gauges, bar charts, and line charts read faster than complex charts.
Use color intentionally, like green and red for on and off track.
Keep it to one screen where possible, with detail available by drill-down.
Step 6: Make It Relevant to Each Leader
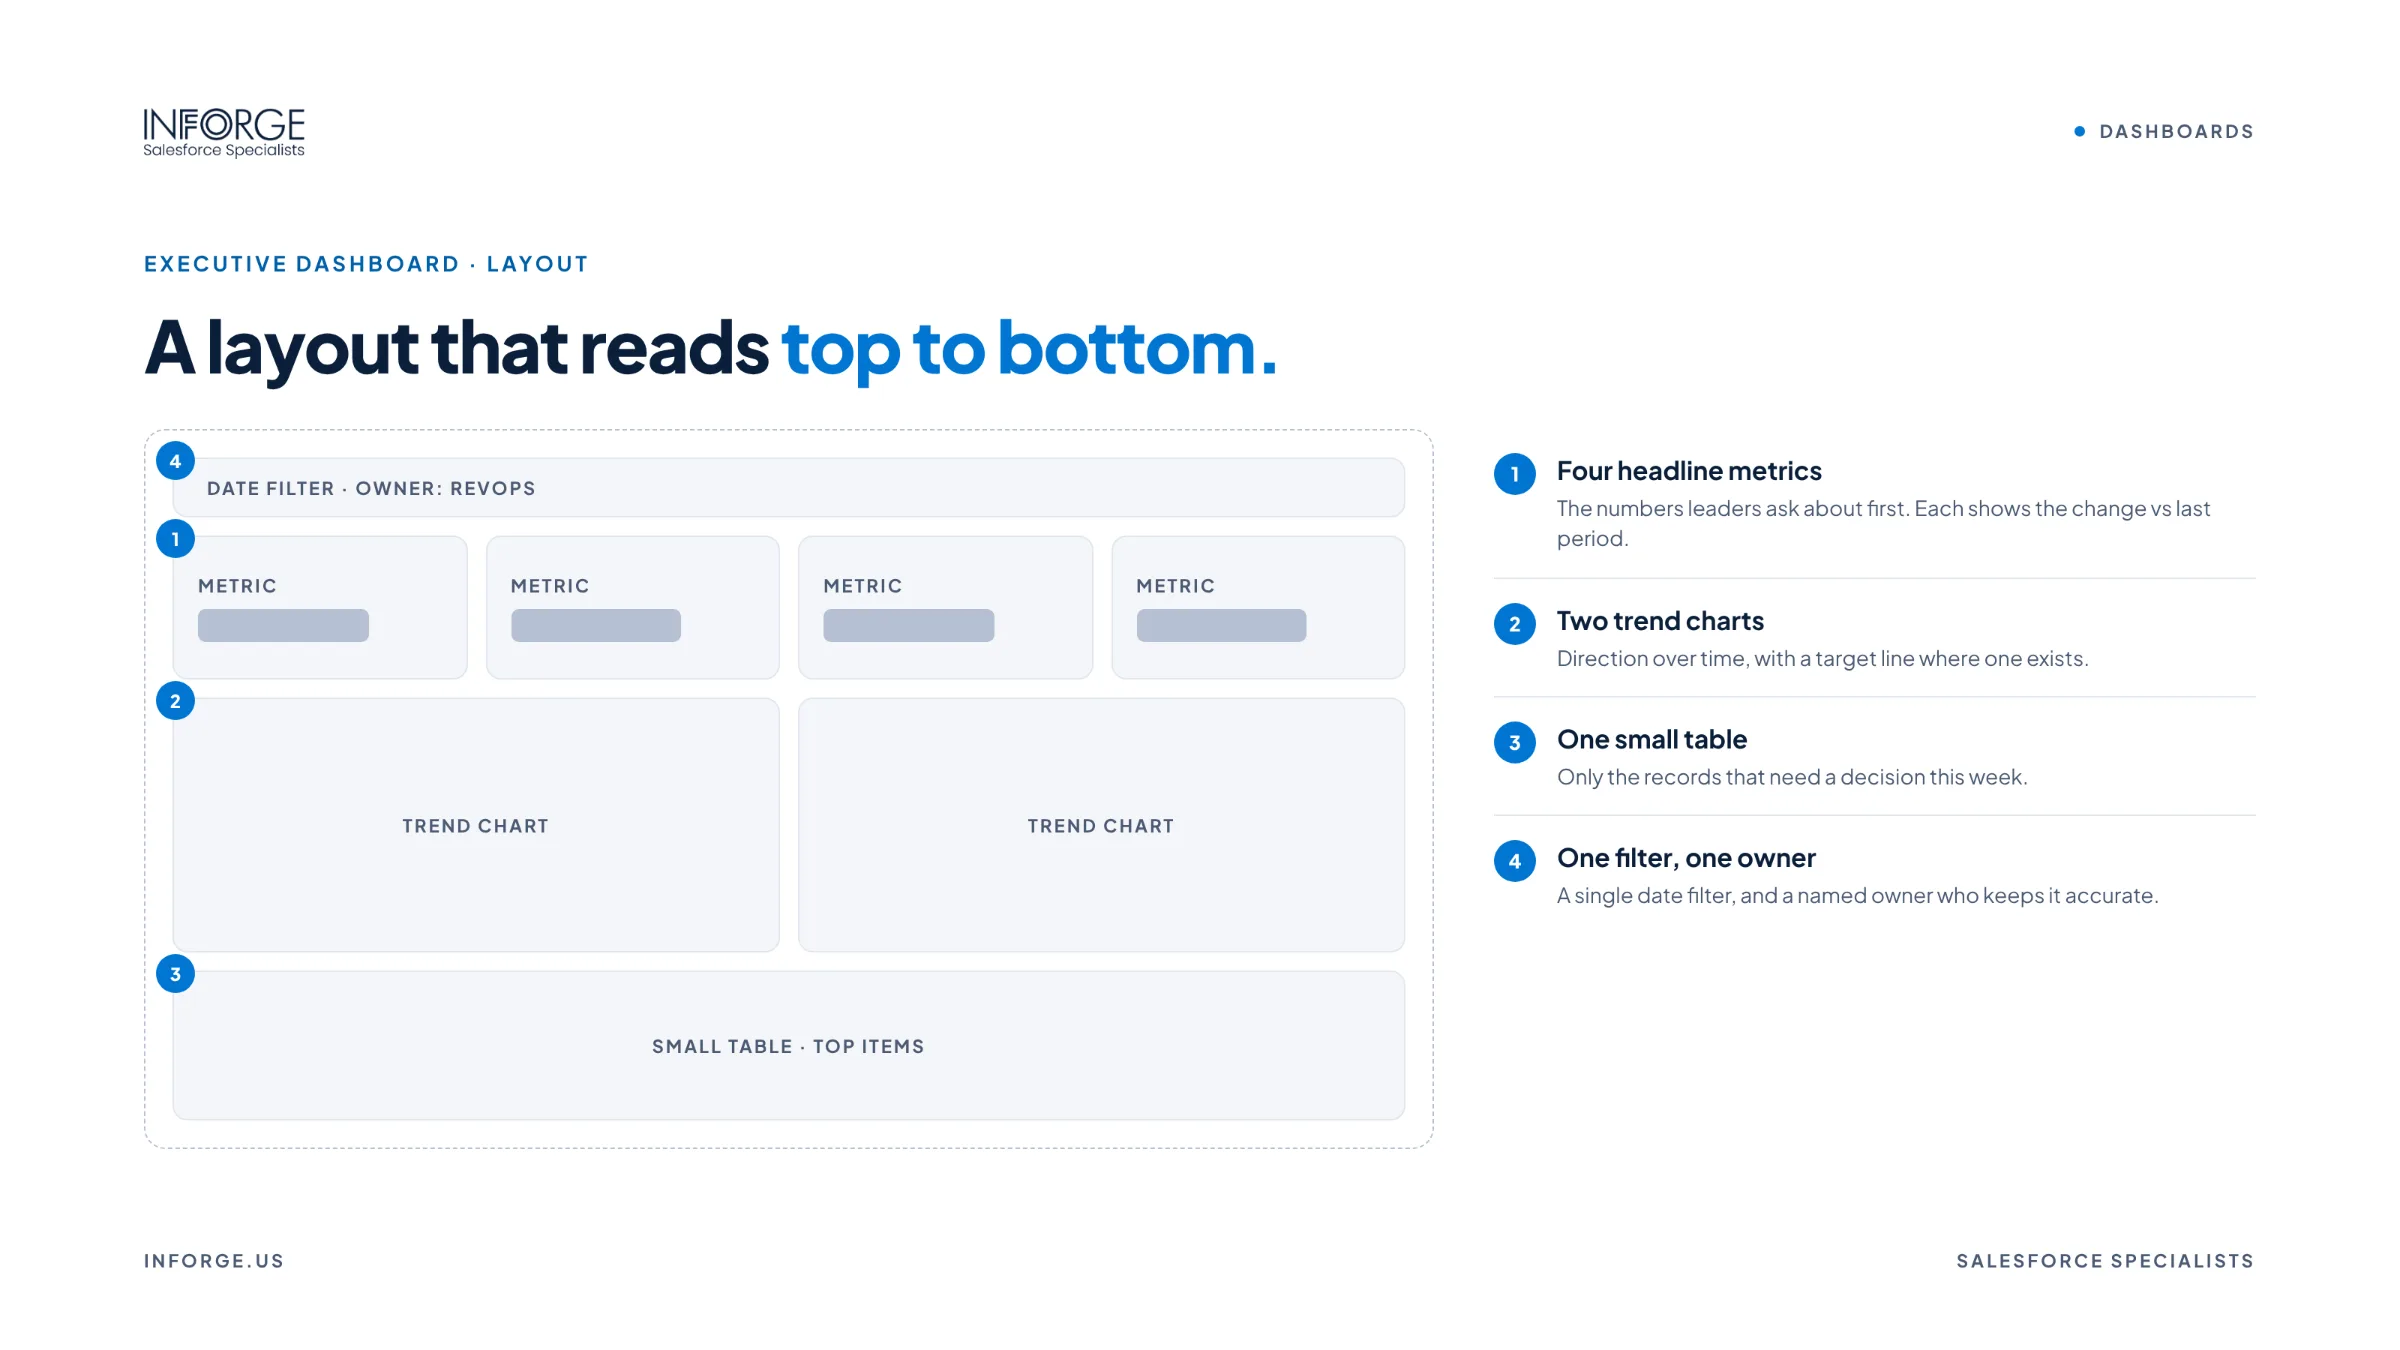
Use dynamic dashboards so each leader sees data based on their own access, and add filters for region, product line, or team. A CRO, a regional VP, and a CFO can use the same dashboard with views that fit their responsibilities, instead of maintaining separate versions.
Step 7: Deliver It Where Executives Already Are
Schedule dashboard subscriptions to arrive by email at the start of the week, make the dashboard available on mobile, and share it in Slack where leadership already communicates. The easier it is to see, the more it gets used.
Step 8: Build It Into the Operating Rhythm
The single biggest driver of adoption is using the dashboard in leadership meetings. When the weekly pipeline review or monthly business review runs from the Salesforce dashboard instead of slides, everyone has a reason to keep the data accurate, and the dashboard becomes the source of truth.
Review the dashboard with leaders every quarter. Retire metrics that no longer matter and add new ones as priorities change.
At Inforge, we've found that the executive dashboards that get used every week aren't the most visually impressive ones. They're the ones built around real decisions, backed by clean data, and used to run leadership meetings.
Summary
Most executive dashboards fail because they show too much, rely on inconsistent or untrusted data, or don't fit how leaders make decisions. To build Salesforce dashboards executives will actually use, start with the decisions they make, choose five to eight clearly defined metrics, clean the data first, design for a 60-second read, personalize views with dynamic dashboards and filters, deliver them where executives already work, and build them into leadership meetings. Do that, and the dashboard becomes the source of truth for running the business.
Inforge helps companies design Salesforce dashboards and reporting that leaders trust, with nearshore Salesforce admins, consultants, and analysts working in your time zone.
Frequently Asked Questions
Q: What should be on a Salesforce executive dashboard?
A: Focus on five to eight metrics tied to company goals, such as bookings versus target, pipeline coverage, win rate, average deal size, sales cycle length, forecast, retention, and service performance where relevant.
Q: Why don't executives use our Salesforce dashboards?
A: The most common reasons are too many components, metrics that don't support decisions, inconsistent definitions, data executives don't trust, and dashboards that aren't part of regular leadership meetings.
Q: How many components should an executive dashboard have?
A: As few as possible while still answering the key questions. Many effective executive dashboards have around six to ten components, with detail available through drill-down or linked dashboards.
Q: What is a dynamic dashboard in Salesforce?
A: A dynamic dashboard shows data based on the access of the person viewing it, so different leaders can use the same dashboard and see the data relevant to them.
Q: How do we make sure dashboard data is accurate?
A: Clean duplicates and stale records, enforce required fields at key stages, standardize picklists, define metrics clearly, and assign an owner to monitor data quality on an ongoing basis.